A multitouch interactive tool
In this project, we aimed to introduce a tool for exploring multivariate data, capitalizing on the increased availability and affordability of touch-based systems. Our objective was to teach data visualization and exploration concepts to young learners using various multitouch interaction techniques as shortcuts to expedite tasks.

MY ROLE
RESULTS
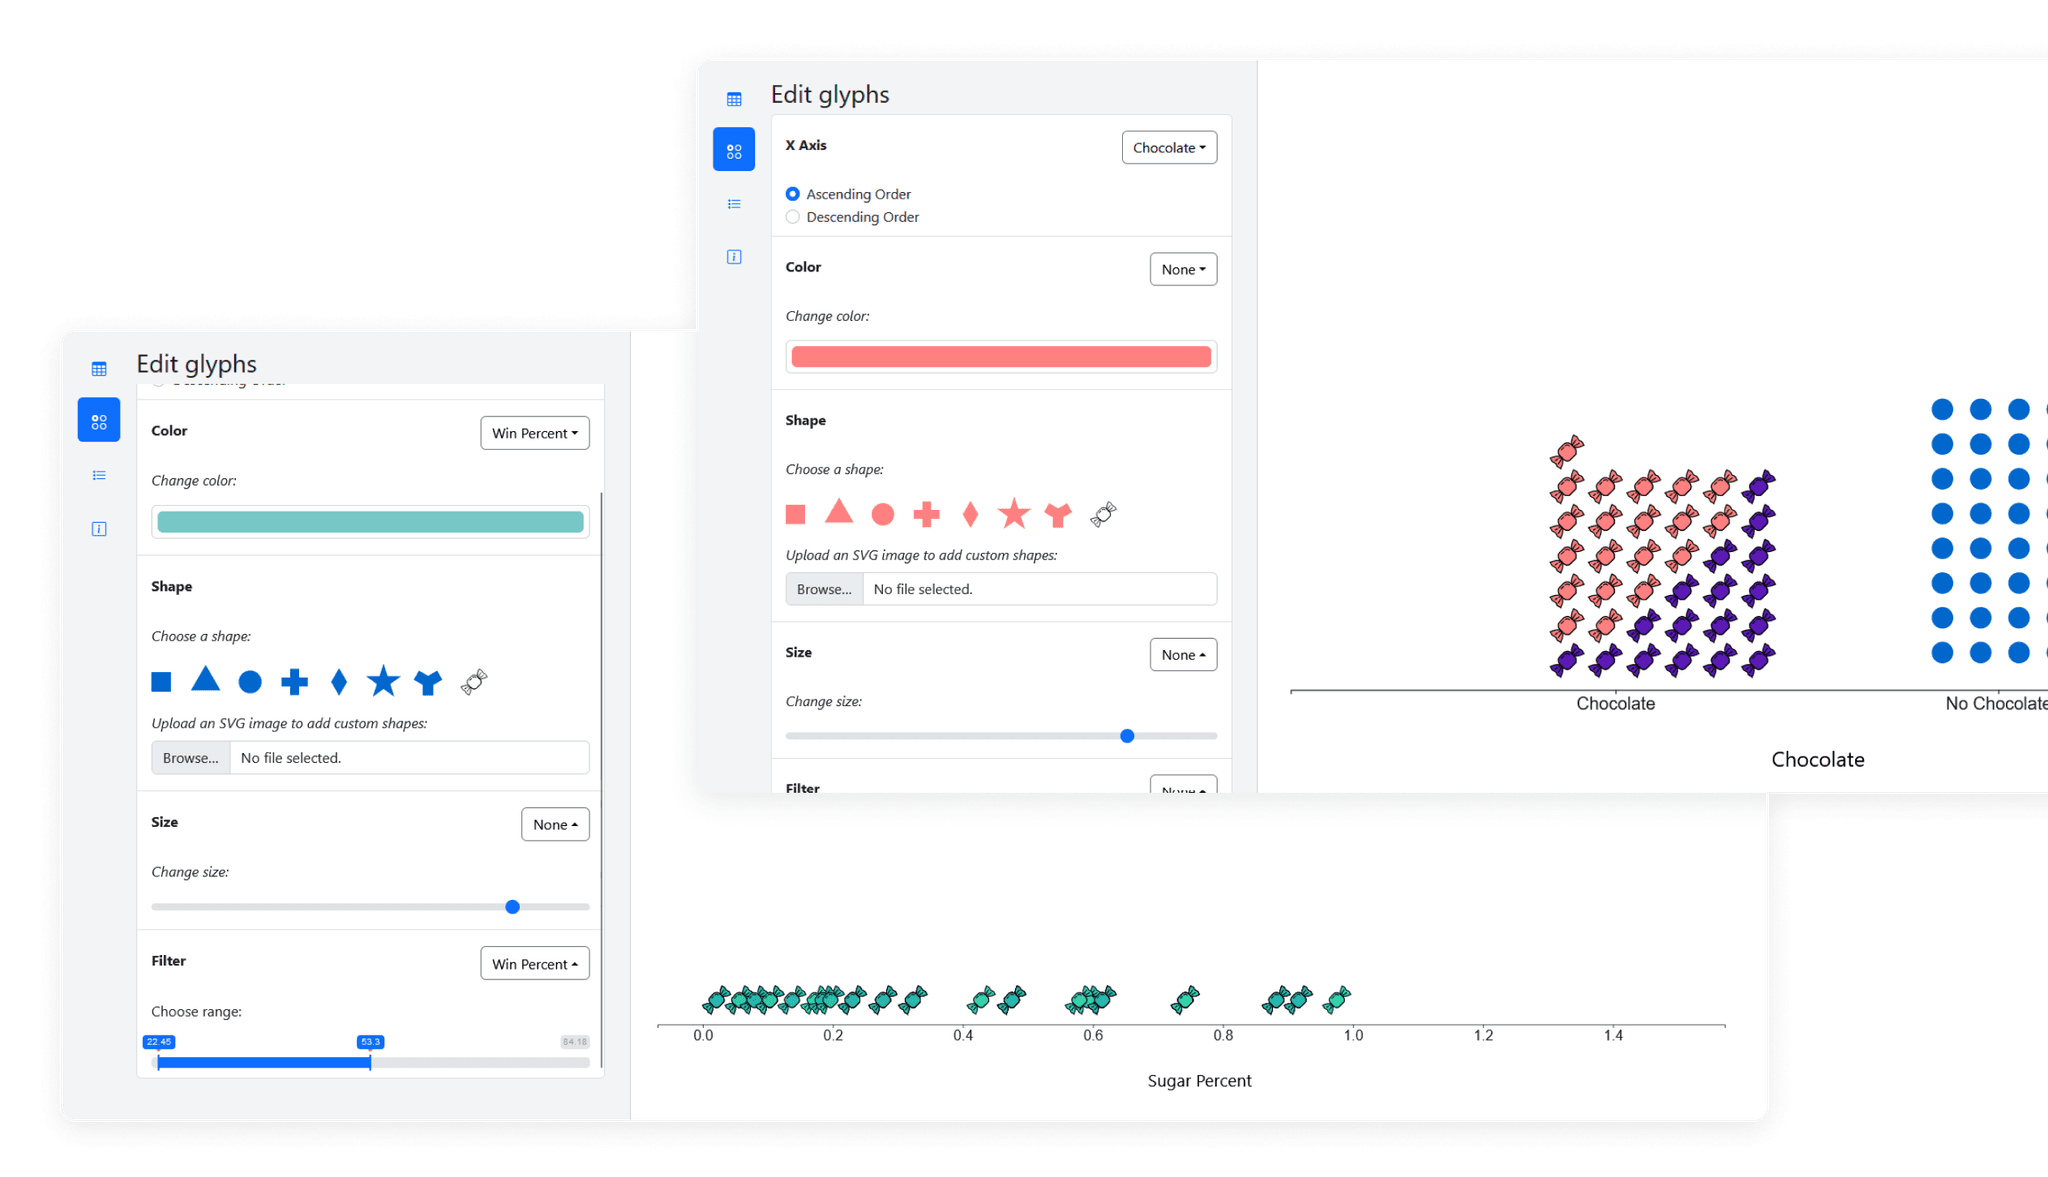
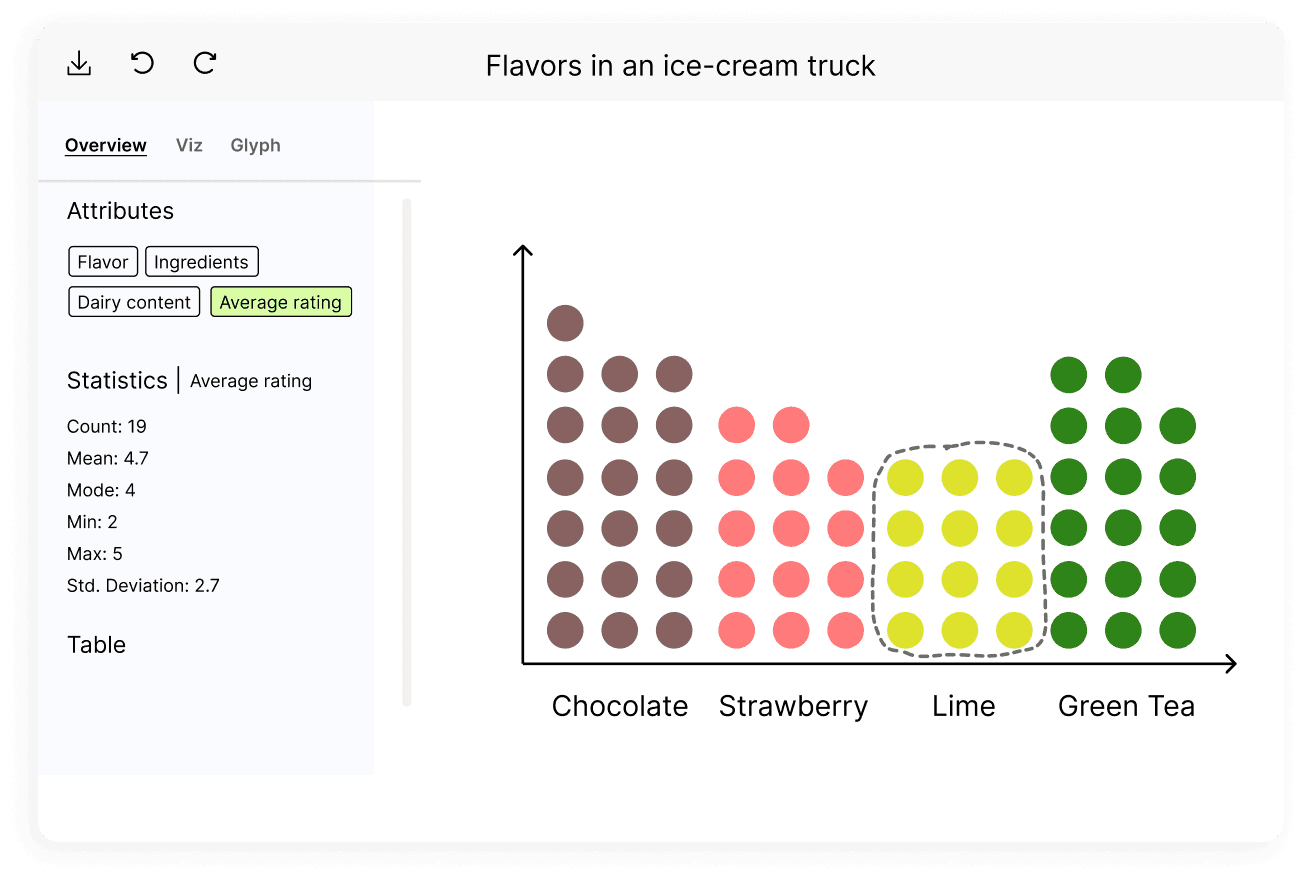
We designed and implemented a multitouch interactive data-visualization tool targeted at middle-school students to facilitate data exploration practice. The tool was primarily developed using JavaScript (including D3.js), HTML, and CSS. It enables users to interact via pointers, allowing for the use of fingers (touch) or a stylus interchangeably. Most functions are also accessible through alternative mouse clicks or mouse wheel interactions.
Based on our literature review, we decided to build a guided data exploration tool that leverages active interaction techniques for analysis.
PROBLEM SPACE
Our literature review revealed that guided interactive learning—where learners actively engage with information to build their own mental representations—is associated with improved comprehension. Furthermore, visualizations with interactive capabilities were found to enhance comprehensibility significantly. Based on these findings, we developed a guided data exploration tool that leverages active interaction techniques for analysis.
FEATURES
After researching similar tools such as TinkerPlots, Kinetica, and DataBreeze, we outlined our requirements, including:
Unit Visualizations: The tool utilizes unit visualizations as the charting type due to their intuitive nature, direct mapping to each data point, and flexibility to transform into various visualization types like dot plots, scatter plots, and beeswarms. This approach also supports accessing details on demand.
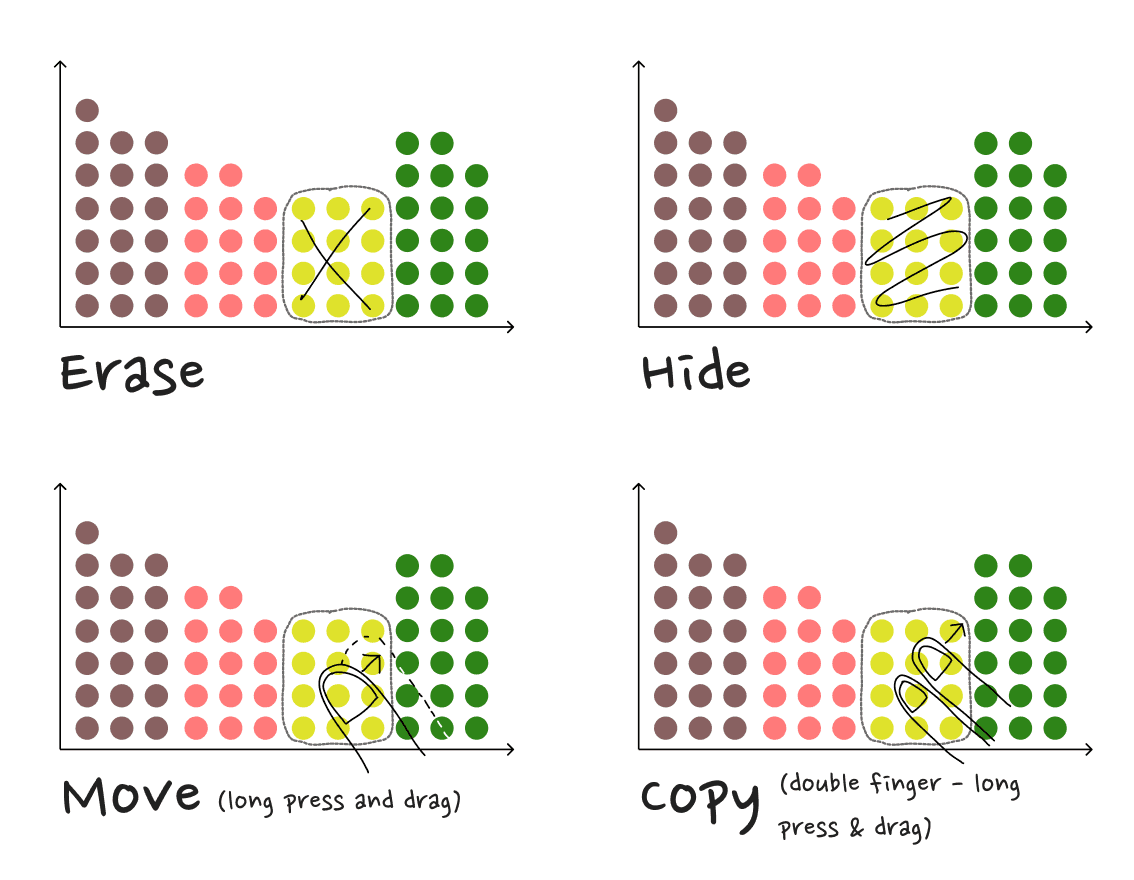
Zoom and Pan: We addressed the limitation of the 'pinch to zoom' option with fixed aspect ratios in scatter plots by enabling pinching both on the chart and along an axis. Users can also perform a lasso selection when zoomed in. For panning, we implemented a single-pointer drag along the axis to avoid interfering with lasso selection.
Sorting and Updating: Users can change the order of attributes along an axis by long-pressing on the axis label, avoiding interference with axis zoom/pan. Updating the x-axis attribute can be performed via a four-pointer swipe on the chart area, also achievable from the control panel.
Undo/Redo: Actions can be reversed with a three-finger swipe to the right, or redone with a swipe to the left on the chart.

CHALLENGES
We encountered several challenges:
Browsers such as Firefox and Chrome recognized multiple pointer-downs but tracked pointer-moves for only one pointer at a time.
Conflicts between touch and mouse interactions led to issues, such as tooltips activating incorrectly. We temporarily disabled actions on mouseover to mitigate this, although it remains a limitation for mouse users.
Some multitouch interactions conflicted with system and browser default shortcuts, like long presses opening context menus. We disabled these default gestures, but this solution may not be ideal for users accustomed to these shortcuts.

